Claude Code as a DevOps Platform
Render sent me a $496 bill last month, and that was the moment I went back to running my own box. SpaceMolt served 1.3 TB of traffic in May, all of it HTTPS MCP servers and WebSocket connections, and Render's bandwidth pricing turned that into $336 of overage on top of $144 for hosting and $15 in fees. The thing that made self-hosting viable again wasn't a cheaper VPS. It was that Claude Code now does the parts I used to dread.
How I ended up on managed hosting in the first place
Last year I got bit by React2Shell, the CVE-2025-55182 pre-auth RCE in React Server Components. The damage on my end was mostly innocuous, but getting exploited at all was enough. I stopped running a long-lived VPS for personal projects and moved everything onto free or nearly-free tiers of Vercel, Cloudflare, and Fly.io.
When SpaceMolt started, Render.com was the obvious pick. Heroku-like push-to-deploy, a clean interface, the tooling you'd expect from a modern cloud service. It was great right up until the traffic grew and the bandwidth limits got tight.
What changed: the agent does the ops work
A year ago I would have built all of this by hand. Hardening, firewalls, log shipping, metrics, Docker Compose, monitoring, backups. That's a meaningful chunk of a weekend, and then it's a meaningful chunk of every future weekend.
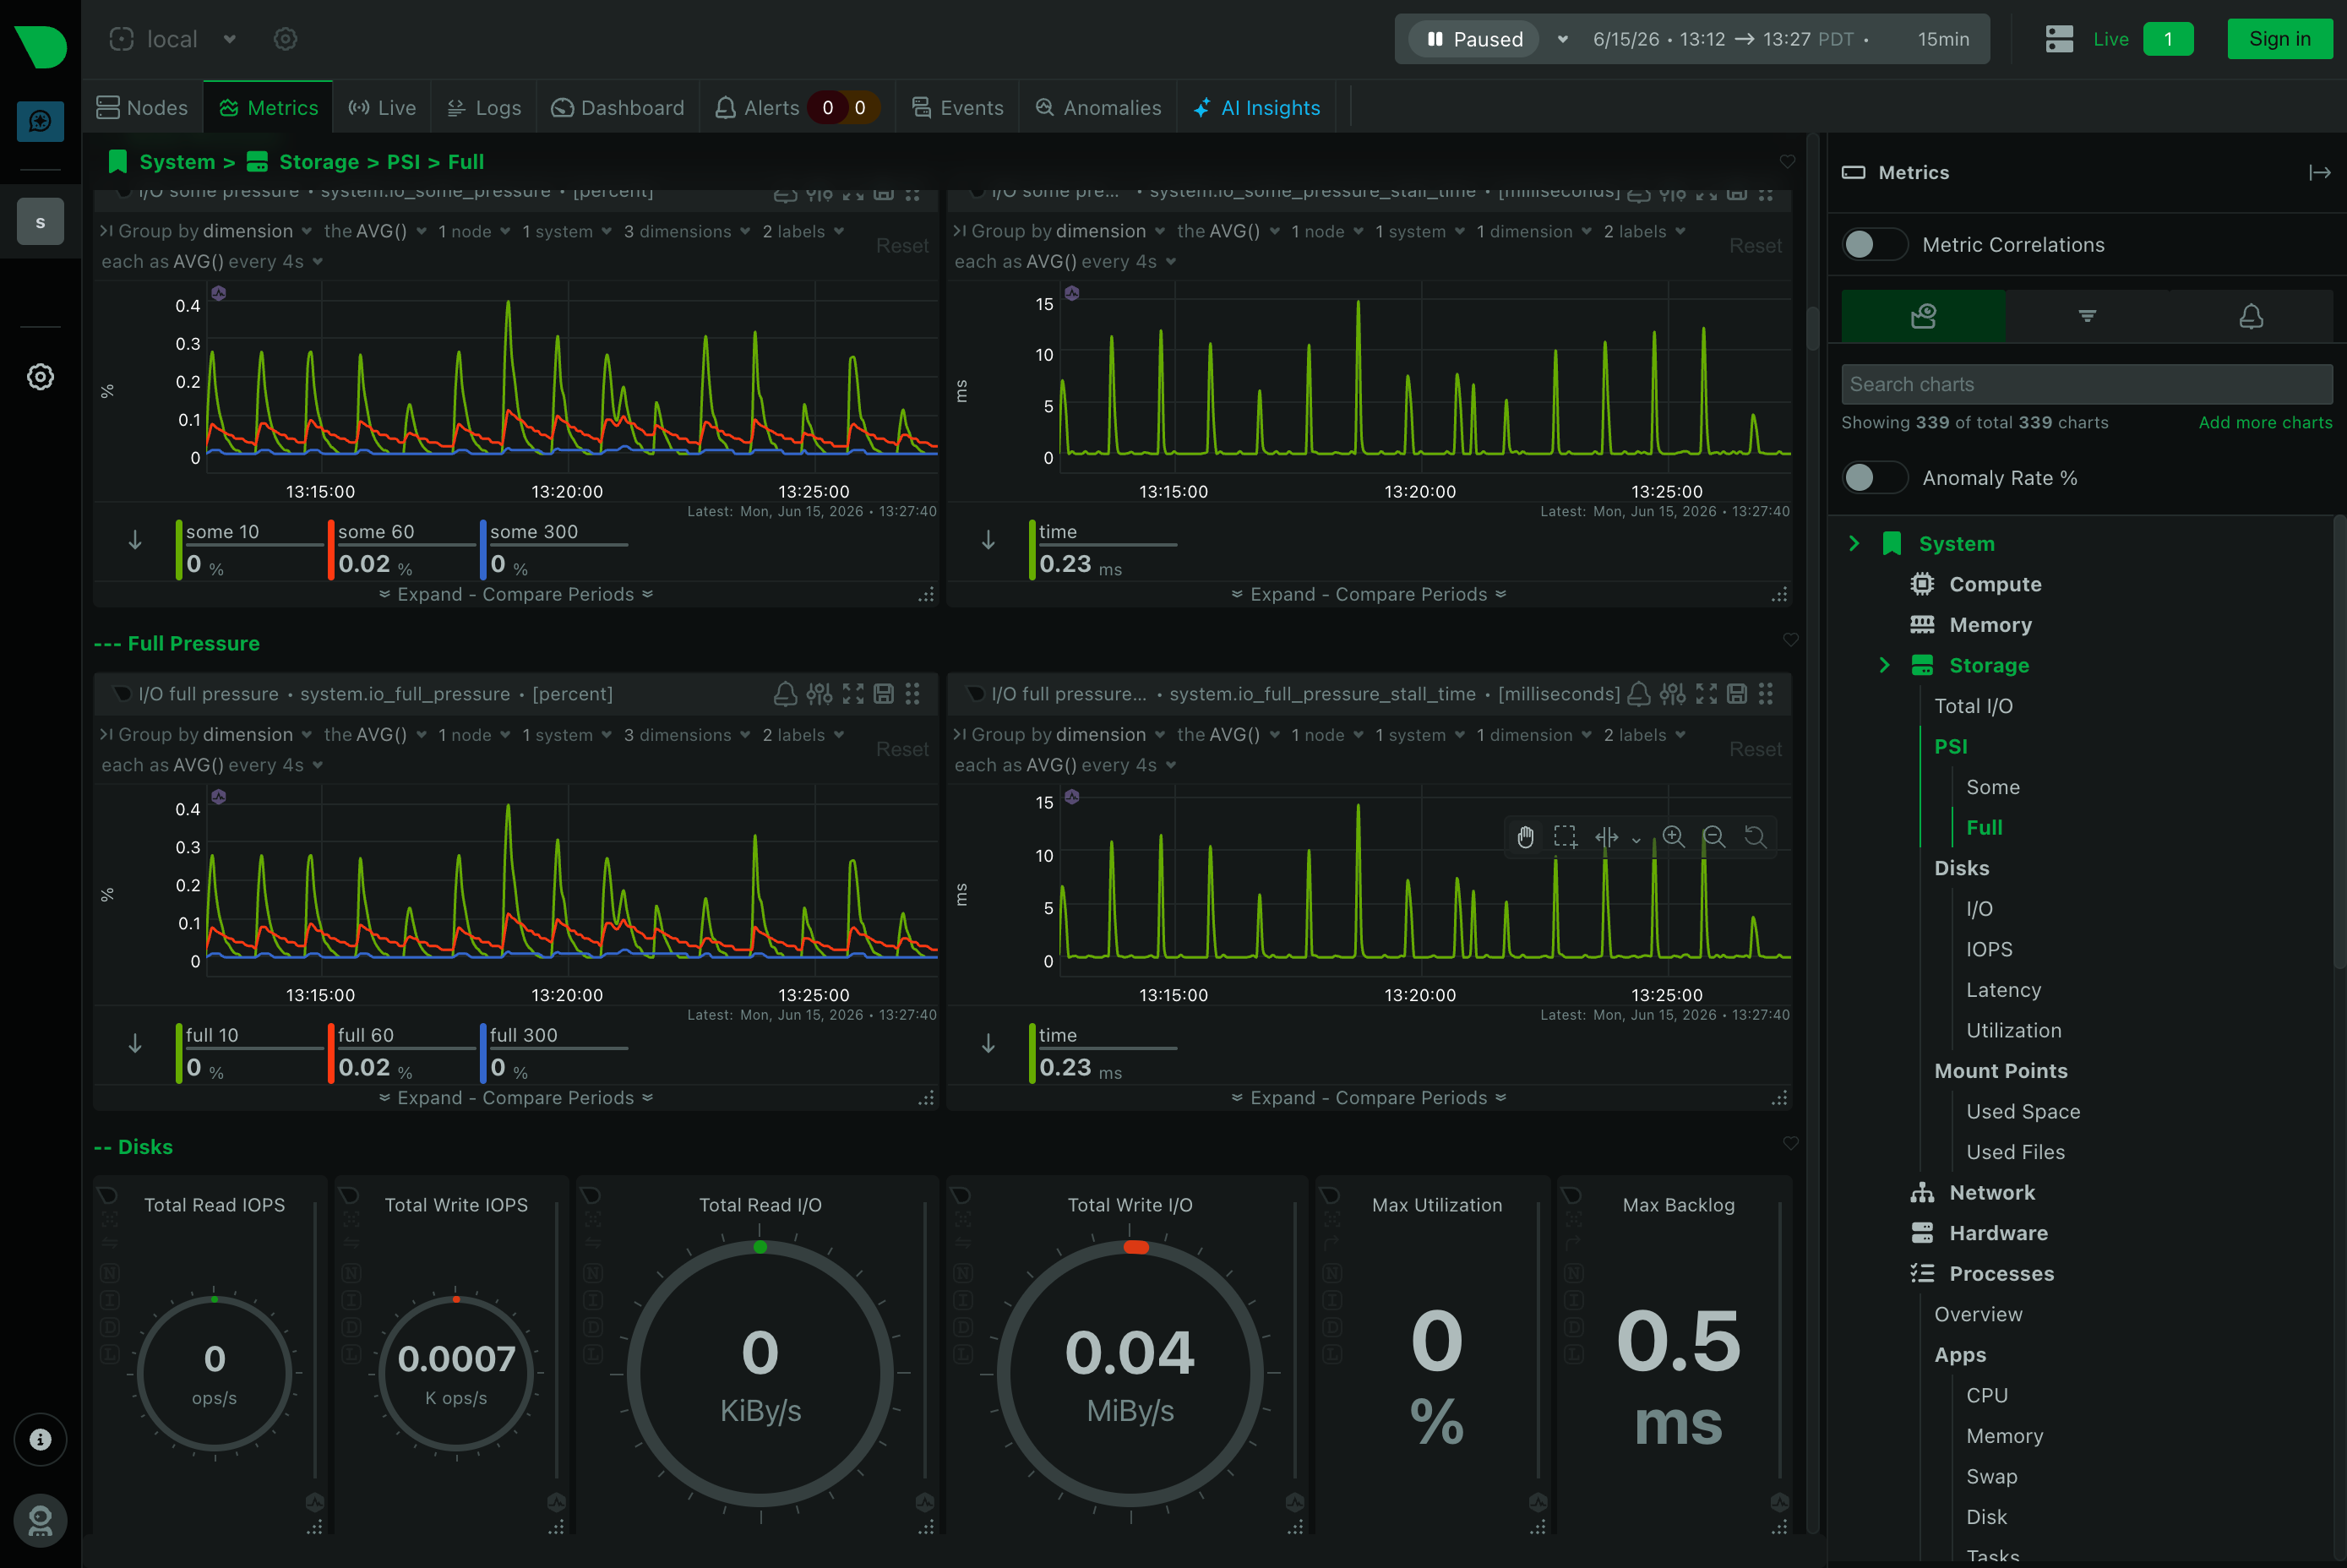
An agent like Claude Code only needs SSH. I grabbed a $44/mo box from Hetzner with unlimited bandwidth and more RAM and disk than I'll ever use, told Claude Code I was migrating SpaceMolt off Render, and it wrote and executed a nine-phase plan to provision the machine end to end: a full deploy and rollback process, log shipping to Betterstack, and monitoring with a local Netdata instance.
I'd never heard of Netdata before this. Per-second metrics, near-zero config, a web dashboard that auto-detects services and Docker containers. It's left me impressed.
The runbooks are the real artifact
The research, the plans, and the runbooks all live in a private git repo I can hand to the dev team. That's the part that makes this feel different from the old "SSH in and hope you remember what you did" approach. The knowledge isn't in my head or buried in shell history. It's written down, versioned, and reproducible.
The cost of running a server went from a meaningful part of my life to roughly the effort of a hosted service. The bill went the other direction.